Data Science and Statistics are complementary of each other. In 1977, The IASC (International Association For Statistical Computing) was formed. The main aim of this association was to link statistical methods, computer technology and the knowledge of domain experts in order to covert data into information and find precise insights from the data. We can’t imagine Data Science without statistics.
We define Data Science as: Data + Science i.e. get the data, understand it and apply scientific models i.e. mathematical models, statistical methodology, operation research etc. on data to get insights from the data and make data informative. Now the question is: what do you mean by statistics?
Statistics is the collection of data or science in which we play with data. we collect data, analyse it and then get insights from it or this is the most important discipline to analyse and quantify uncertainty.
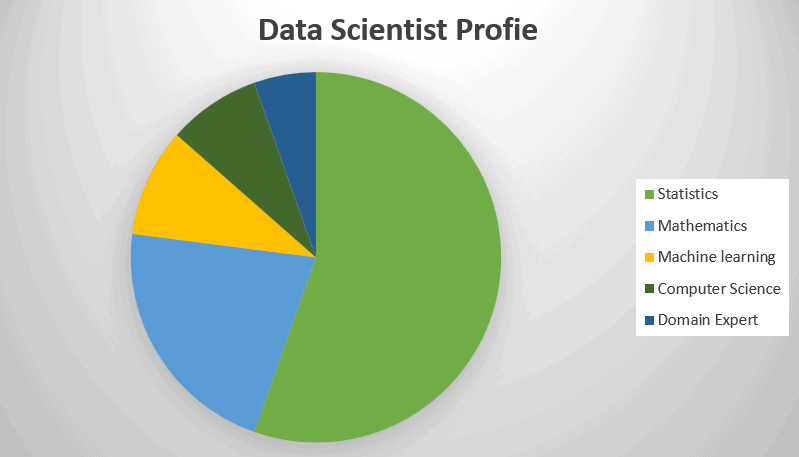
Table of Contents
Relation Between Two Fields
Statistics Plays an important role in Data Science, Statistics is the foundation of Data Science, it is the most important discipline that provide tools and methodology to make data structured and get information from the data.
There is a strong relationship between these two fields. In this modern world data is growing very rapidly in every second so it is very important for a Data Scientist to run the best models on the data and get the precise insights from the data. Now the Question arise: From where these models come? These models comes from Statistics
Machine learning is the widely growing field in Data Science, it is the combination of Computer science and statistics. In Machine Learning we run models on data make data informative & get deeper insights from the data.
Concepts Of Statistics Used in Data Science:
Some Important Concepts of Statistics that are used in Data Science are:
Linear Regression:
Regression Methods are meant to determine the best functional relationship between a dependent and one or more independent variables. The functional relationship of a dependent variable with one or more independent varibles is called a regression equation, if this relationship is linear then it is known as simple regression .The graph of regression is known as curve of regression.
Functional Relationship Of one dependent variable with more than one independent variables, is called multiple regression. The independent variables are known as regressor and dependent variables are called regressed variable. The main aim of regression model is to find the best value of a dependent variable from independent variables.
Let us consider the simple linear regression of Y on X i.e.
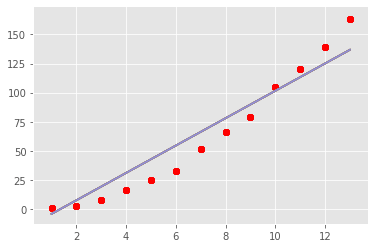
Y=b0+b1X+Ɛ in this equation b0 is the intercept which the line cuts on the Y axis and b1 is the slope of the line, also called regression coefficient. Ɛ is the error term which is normally distributed. The regression line is of the type as shown in the graph below:
The regression equation is also known as estimating or predicting equation and the regression line is also known as the line of average relationship.
Classification:
In classification Problems we also predict the value of a dependent variable based on a given set of independent variables as like in regression but the main difference between them is : in regression variables are real and in classification variables are not real, classification is used when the variables are categorical .for example:
if we want to predict the message is “spam” or “not spam”, either a person has “diseases” or not. In classification problems we used the models like Logistic Regression, Decision Tree etc.
Sampling Methods:
we use sampling in our day -to-day life. when complete enumeration of the population is not possible then we use sampling. For example, we want to test either the chalk is “dustless” or “not”, in this case we can’t break every chalk to test, so we prefer sampling in these cases. Complete enumeration of population is time consuming and expensive due to large size of population that’s why we use various sampling techniques for testing of these large populations.in sampling we draw a sample (subset of population) and get inferences about population based on this sample. Various sampling techniques are simple random sampling, stratified sampling, systematic sampling, clustering etc.
In Data Science we use these techniques many times. For example, we use clustering when run the model k mean clustering on data and draw inferences. In this we divide the data into clusters (groups) and then use these clusters to get insights from the data.
Time series Analysis:
Time series is a set of events measured at a time or in specific intervals of time. for example, weekly demand of a commodity, monthly sale of a product etc. Components of time series are:
- Secular Trend
- Seasonal Variations
- Cyclic Variation
- Irregular Variation
In machine learning we use various models like:
- ARIMA (Autoregressive integrated Moving Average),
- LSTM(Long-Short-Term-Memory),
- FB PROPHET etc.
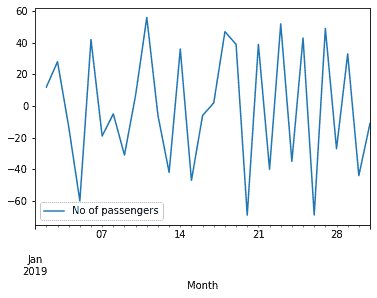
These Models are use to analyze the time series data and predicting future values. Below is the image showing the number of passengers in a train in a month showing day by day variations in the number of passengers in a train.
Hypothesis testing:
Hypothesis plays a crucial role in Data science. In hypothesis testing we work on samples rather than population. Hypothesis is nothing but a statement. In other word we can say that hypothesis is a procedure based on which one can decide whether the hypothesis is rejected or accepted. Two type of hypothesis are:
- Null Hypothesis: Null hypothesis is the hypothesis of no difference. According to R. A. Fisher, any hypothesis which is tested for its possible rejection is called a null hypothesis and is denoted by H0. In a test of means if we say H0: µ1=µ2 it means there is no significant difference between the means of two populations.
- Alternative Hypothesis: Null hypothesis and alternative hypothesis both are mutually exclusive statements. Alternative hypothesis gives results Alternative to the null hypothesis, it is denoted by H1. In a test of means if we say H0: µ1=µ2, then alternative is H1: µ1 ≠µ2 it means there is a significant difference between the means of two population.
- P value: p value is the statistical concept widely used in Data Science in hypothesis testing. Large value of p indicates there are more chances to be null hypothesis true alternatively small value of p indicates that there are more chances that null hypothesis is rejected. P value in mostly cases is the value of alpha (level of significance). P value is used to take decision i.e. we compare the value of p with the value of test statistic and then take decisions.
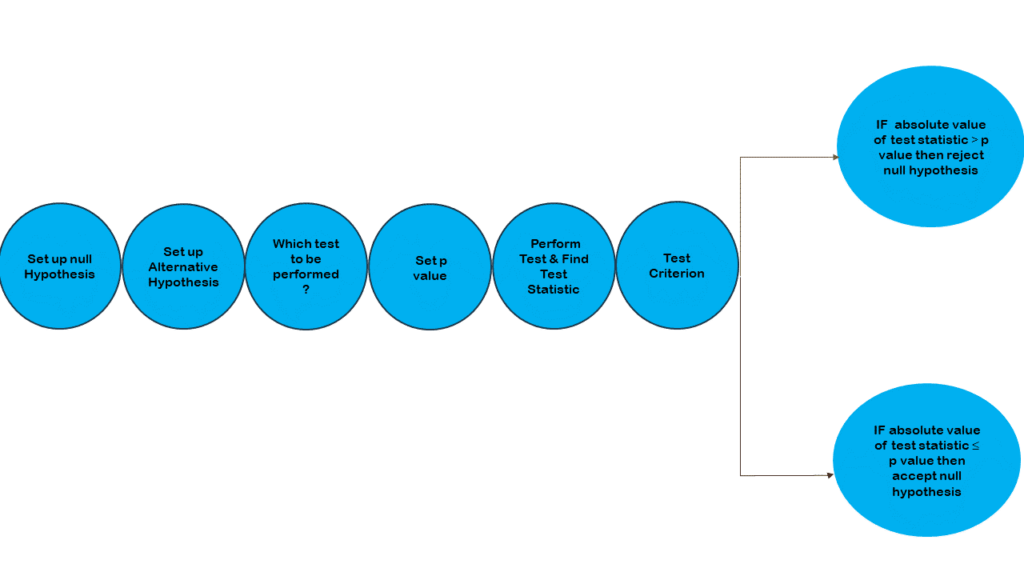
Following are the steps of hypothesis testing:
- Set up Null and Alternate Hypothesis
- Based on the data, analyze which test to be performed
- Select the level of significance or p value
- Set up the test criterion.
- Perform test and find the test statistic value.
- Then compare p value and test statistic and make decisions.
Conclusion:
To summarize, we can say that statistics plays vital role in Data Science as most of the models of Data Science has statistical concepts. We can’t interpret results of our models that are applies on data if we don’t have statistical knowledge. If a Data Scientist has a knowledge of statistical concepts and computer then he/she can give a beautiful shape to the data. Hence, we can say that statistics works like backbone in Data Science.


1 thought on “THE POWER OF STATISTICS IN DATA SCIENCE”
Very informative.